

Power to redefine the 1L standard of care in HER2+ advanced GEA1
ZIIHERA + tislelizumab + CT achieved an mOS surpassing 2 years, the longest reported in 1L HER2+ advanced GEA history1,2

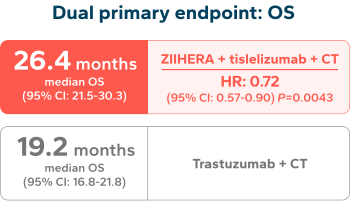
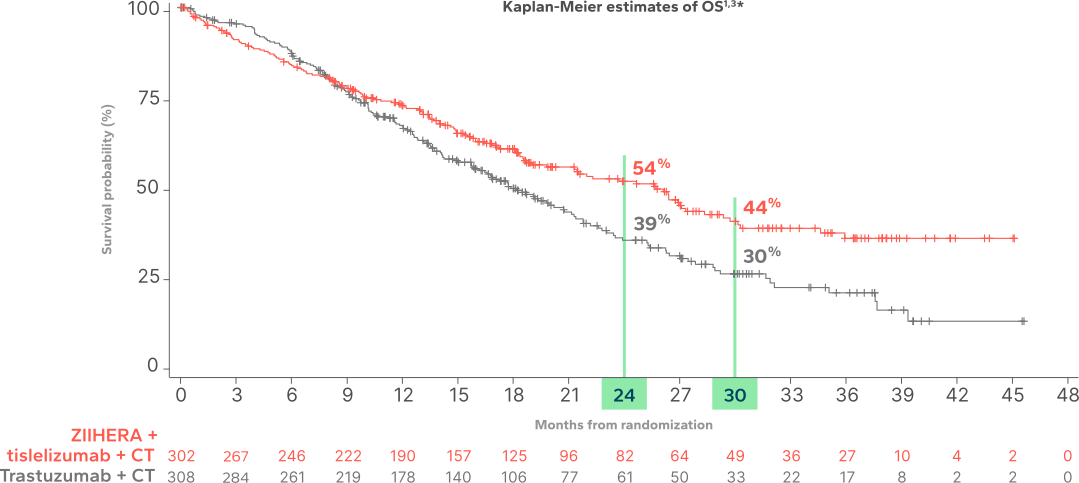
Median follow-up was 26 months for both treatment regimens.3
Landmark OS estimates at 24 and 30 months were prespecified and not powered to demonstrate statistically significant differences or treatment effect. No conclusions can be drawn from these analyses.3,4
28% REDUCTION IN THE RATE OF DEATH WITH ZIIHERA + TISLELIZUMAB + CT vs TRASTUZUMAB + CT1
In prespecified exploratory analyses of patients with HER2 IHC 3+ that received ZIIHERA + tislelizumab + CT (n=251) and trastuzumab + CT (n=255), mOS was 27.3 months (95% CI: 22.3-NE) and 19.8 months (95% CI: 16.2-22.8), respectively, with a HR of 0.70 (95% CI: 0.55-0.91). In prespecified exploratory analyses of patients with IHC 2+/ISH+ that received ZIIHERA + tislelizumab + CT (n=51) and trastuzumab + CT (n=52), mOS was 21.5 months (95% CI: 16.0-26.4) and 18.7 months (95% CI: 13.6-23.1), respectively, with a HR of 0.83 (95% CI: 0.50-1.39).1,5
Dual primary endpoint was OS. OS is the time from randomization until death from any cause. Estimates per Kaplan-Meier method; CIs based on Brookmeyer and Crowley method with log-log transformation. P-value was calculated by stratified log-rank tests. Hazard ratio and 95% CIs were calculated in comparison with trastuzumab + CT stratified by geographic region, HER2 status, and ECOG performance status.1,6
*Month 24: 54% (95% CI: 47.6-60.5); 39% (95% CI: 32.2-45.4); Month 30: 44% (95% CI: 36.5-50.9); 30% (95% CI: 23.4-36.8). Two-sided 95% CIs of landmark OS estimates based on Greenwood estimator.3,4
Get notified when updated survival data, subgroup analyses, or other results are available from HERIZON-GEA-01.
RECEIVE UPDATESZIIHERA + tislelizumab + CT achieved superiority in PFS vs trastuzumab + CT1

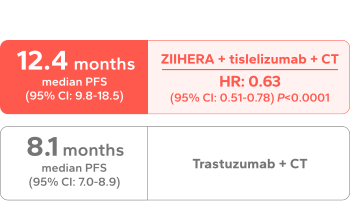
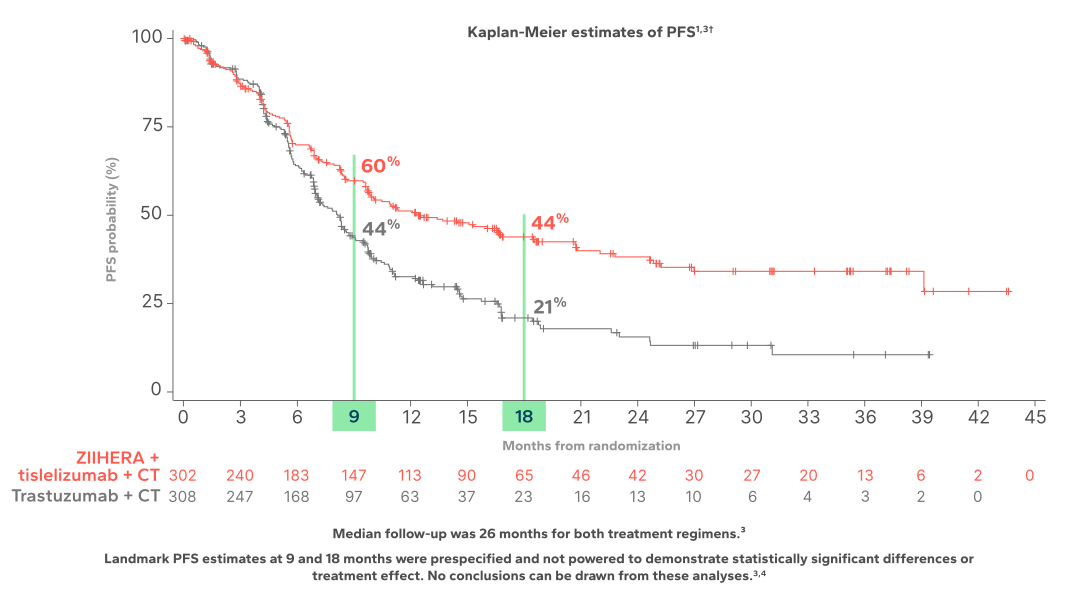
Median follow-up was 26 months for all treatment regimens.2
Landmark PFS estimates at 9 and 18 months were prespecified and not powered to demonstrate statistically significant differences or treatment effect. No conclusions can be drawn from these analyses.2,3
37% reduction in the rate of progression or death with ZIIHERA + tislelizumab + CT vs trastuzumab + CT1
In prespecified exploratory analyses of patients with HER2 IHC 3+ that received ZIIHERA + tislelizumab + CT (n=251) and trastuzumab + CT (n=255), mPFS was 16.1 months (95% CI: 10.9-22.0) and 7.6 months (95% CI: 6.9-8.5), respectively, with a HR of 0.54 (95% CI: 0.43-0.69). In prespecified exploratory analyses of patients with IHC 2+/ISH+ that received ZIIHERA + tislelizumab + CT (n=51) and trastuzumab + CT (n=52), mPFS was 8.6 months (95% CI: 6.7-11.1) and 10.0 months (95% CI: 6.9-18.4), respectively, with a HR of 1.08 (95% CI: 0.65-1.78).1,5
Dual primary endpoint was PFS by BICR per RECIST v1.1. PFS is the time from the date of randomization to the date of documented radiographic disease progression (per RECIST v1.1 assessed by BICR) or death from any cause, whichever occurs first. Estimates per Kaplan-Meier method; CIs based on Brookmeyer and Crowley method with log-log transformation. P-value was calculated by stratified log-rank tests. Hazard ratio and 95% CI were calculated in comparison with trastuzumab + CT stratified by geographic region, HER2 status, and ECOG performance status.1,6
†Month 9: 60% (95% CI: 53.6-65.4); 44% (95% CI: 37.5-49.7); Month 18: 44% (95% CI: 37.4-50.1); 21% (95% CI: 15.3-27.2). Two-sided 95% CIs for landmark PFS estimates based on Greenwood estimator.3,4
Survival outcomes by PD-L1 status7
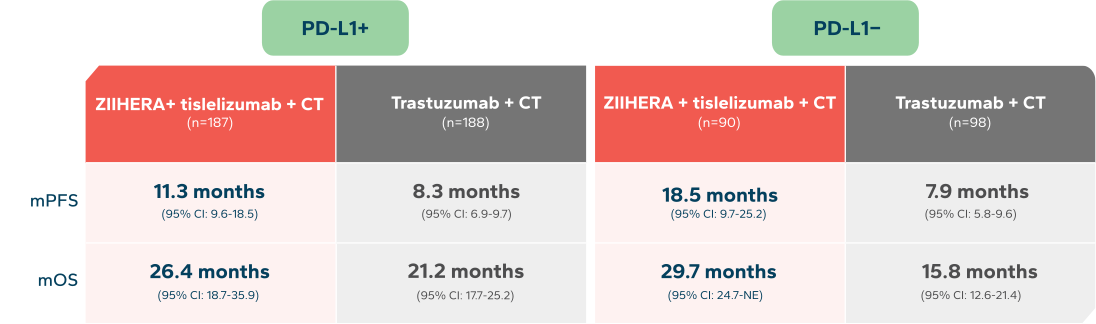
Median follow-up was 26 months for both treatment regimens.3
Results were assessed across prespecified subgroups, including but not limited to geographic region, HER2 status, and ECOG performance status.5
Subgroup analyses were prespecified and exploratory as HERIZON-GEA-01 was not powered to detect treatment-effect differences across subgroups or support conclusions from comparisons within treatment regimens. The widths of the confidence intervals have not been adjusted for multiplicity.2
PD-L1 positivity was defined as TAP ≥1%. PFS is the time from the date of randomization to the date of documented radiographic disease progression (per RECIST v1.1 assessed by BICR) or death from any cause, whichever occurs first. OS is the time from randomization until death from any cause.5,6
Robust and durable responses with ZIIHERA + tislelizumab + CT1
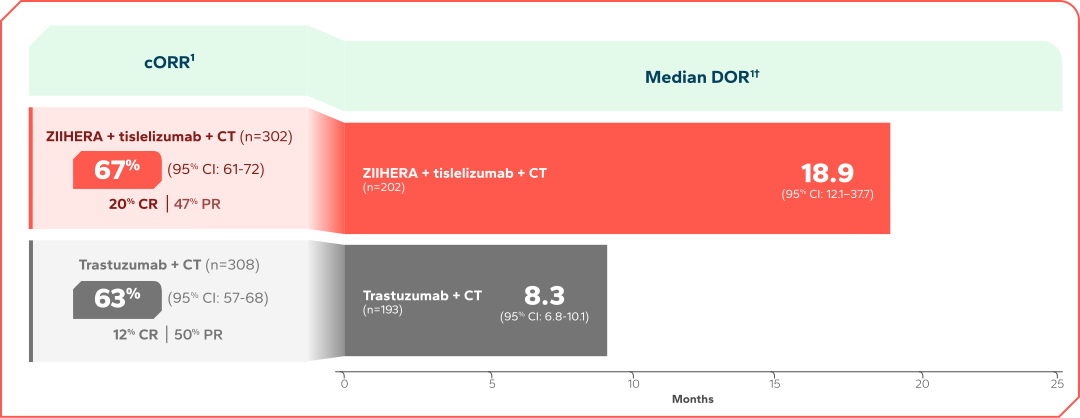
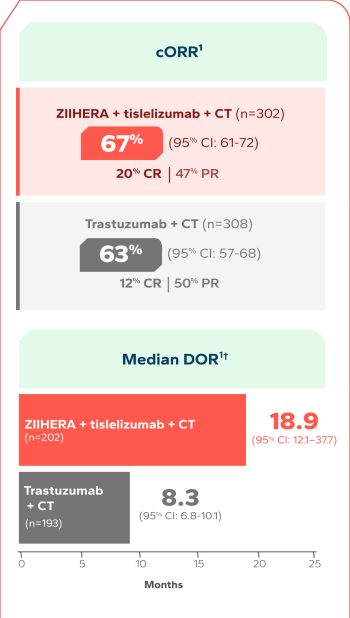
OVER 18 MONTHS mDOR WITH ZIIHERA + TISLELIZUMAB + CT1
cORR and DOR were prespecified secondary endpoints and were not powered to support comparisons across treatment regimens.3
Two-sided 95% exact confidence interval using the Clopper-Pearson method. DOR estimates per Kaplan-Meier method; CIs based on Brookmeyer and Crowley method with log-log transformation.1
*Only patients who had an objective response were included in the DOR analysis.1